Millions of acres in four major Corn Belt states are used to grow "continuous corn” on the same fields year after year, requiring significant use of nitrogen fertilizer. This generates greenhouse gas emissions that are a major part of agriculture's share of U.S. climate pollution.
Some conservation practices can help to reduce the amount of greenhouse gases emitted when growing continuous corn crops. Efforts like growing trees, even on just a small area of a crop field, can have an outsized benefit for the climate, new EWG research finds.
But reforming state and federal conservation and other farm programs will be vital in giving farmers the support they need to pursue these conservation practices.
EWG’s analysis looks at continuous corn grown in the Corn Belt states of Illinois, Iowa, Minnesota and Wisconsin. Just under 15 million cropland acres across the four states are used for continuous corn, representing 20% of the total harvested cropland.
Vast amounts of nitrogen fertilizer are used to grow corn. Nationally, over two thirds of all nitrogen fertilizer applications are for corn. Applying the fertilizer on corn fields generates greenhouse gas emissions, including nitrous oxide. It also leads to nitrate pollution of drinking water and its associated public health harms, including several types of cancer.
Nitrous oxide is around 300 times more powerful than carbon dioxide, another greenhouse gas, meaning it warms the earth much more per ton of gas. Agriculture is the main contributor, representing 79% of U.S. nitrous oxide emissions – it produces four times as much of the greenhouse gas as all other sectors combined. The total nitrous oxide emissions from all sources amounts to 6.1% of total greenhouse gas emissions in the U.S.
Agricultural soil management is the main driver of the sector’s nitrous oxide emissions, particularly the widespread use of fertilizer and manure on crops, and other farm management practices.
U.S. agriculture accounts for roughly 10% of total greenhouse gas emissions. As climate change accelerates, farmers face growing pressure to cut emissions and prevent agriculture from becoming the nation’s leading source of climate pollution. Agriculture’s emissions are expected to increase a quarter of a percent every year through 2050.
Some farmers have already started to implement climate-smart conservation practices on their farm fields. But they urgently need to put more acres into conservation, including diversifying crops and crop rotations.
Farmers can adopt many conservation practices on crop fields to reduce climate emissions. Practices like growing small areas of trees are some of the best to reduce emissions on continuous corn acres in these states. According to EWG's analysis, the top four practices that would generate the largest reductions in greenhouse gas emissions on continuous corn acres in the four states are: riparian forest buffers, tree or shrub establishment, hedgerow planting and windbreak establishment.
And setting aside just a small portion of corn fields for these practices could have a huge climate benefit. Adopting the four practices on just 1% of continuous corn acres each would reduce total greenhouse gas emissions by over 3.67 million metric tons of carbon dioxide equivalent every year – like taking over 850,000 cars off the road.
Implementing proven working lands conservation practices on continuous corn acres can also significantly cut climate emissions.These strategies include diversifying crop rotations to move away from year-after-year corn, eliminating tillage, adopting cover crops, and shifting to more efficient fertilizer types.
Conservation practices also have important benefits for water quality as well. And making changes to federal and state conservation programs in addition to federal commodity programs can help farmers diversify crop rotations and adopt more conservation practices.
Corn is grown continuously on millions of acres
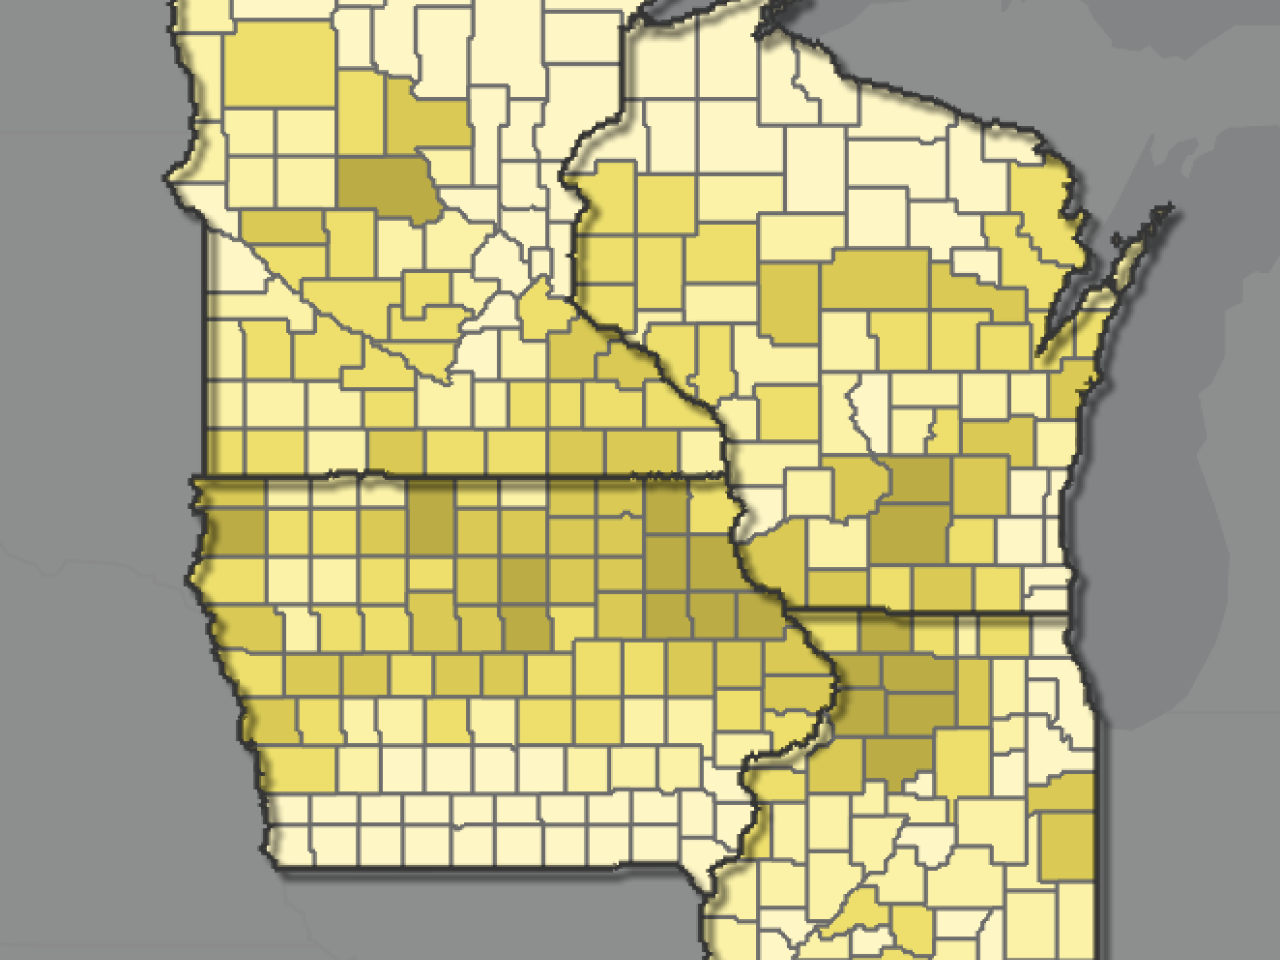
For the 2016-2024 period covered by EWG’s analysis, there were 14.99 million acres of continuous corn in Illinois, Iowa, Minnesota and Wisconsin. This represents 20% of the total 73.55 million harvested cropland acres across the four Corn Belt states. EWG considered any field to be continuous corn if corn was grown on it for at least three consecutive years between 2016 and 2024. Total harvested cropland acres were identified based on the Department of Agriculture’s 2022 Census of Agriculture.
Continuous corn fields in Illinois, Iowa, Minnesota and Wisconsin highlighted in yellow.
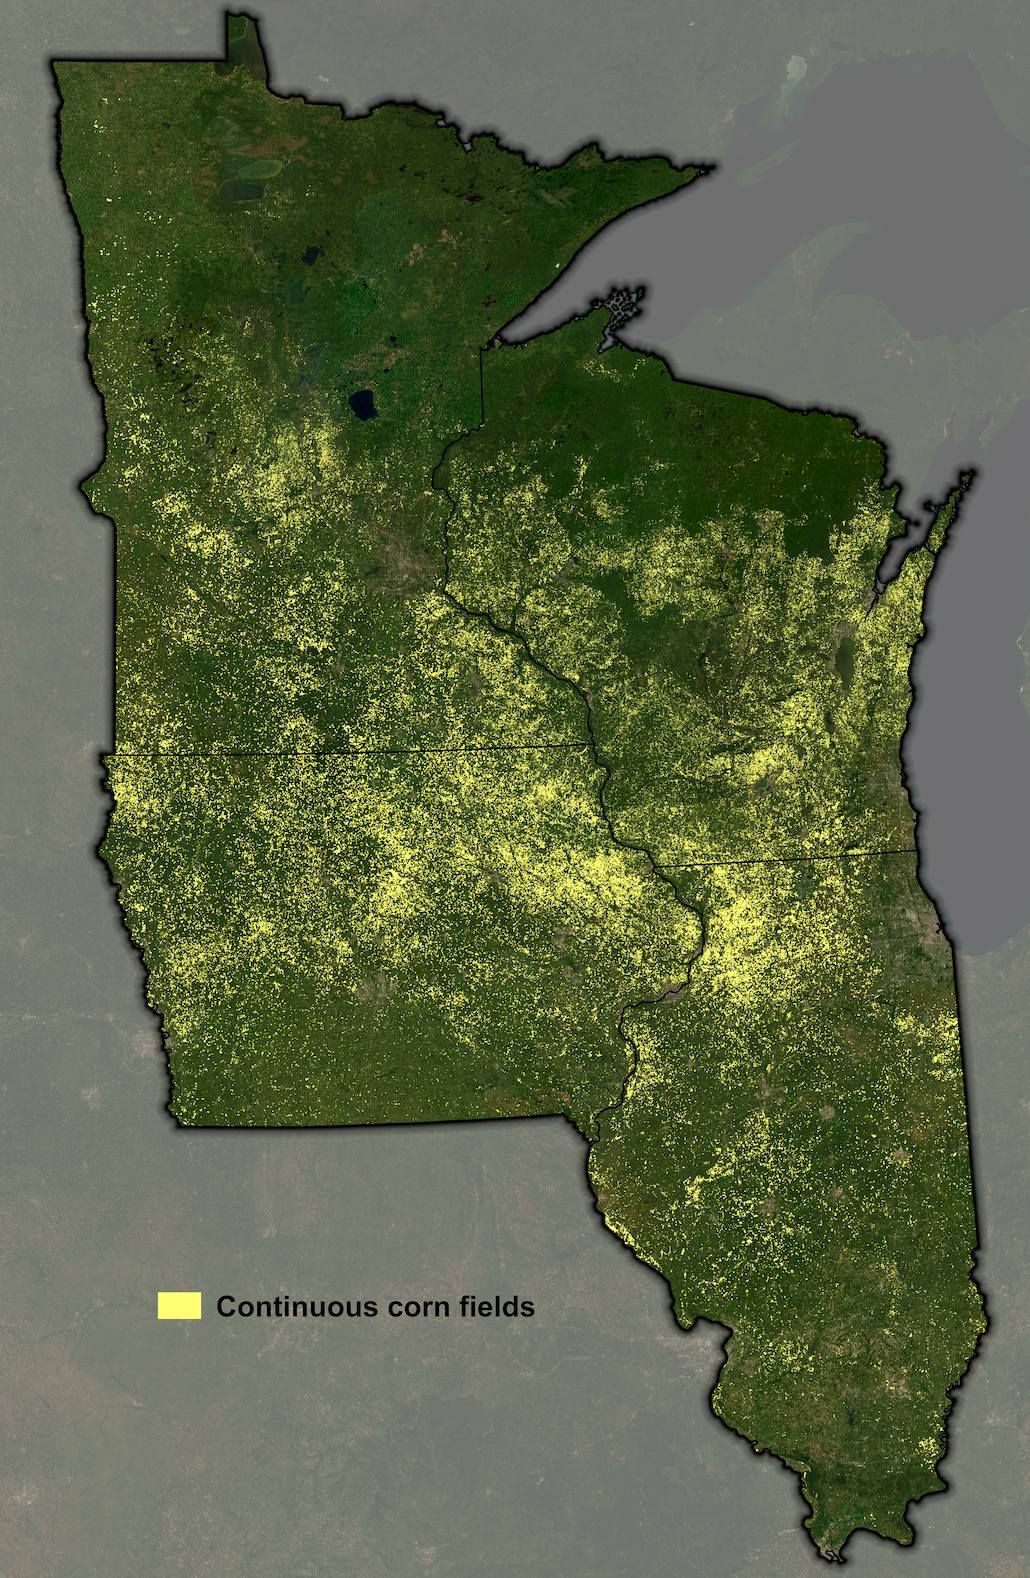
Source: EWG, from an analysis of USDA Cropland Data Layer and Ag Data Commons data.
Out of the four states, Iowa by far had the largest number of continuous corn acres at just under 5.8 million. Wisconsin had the largest share of harvested acres that were used to grow continuous corn at over 35%. (See Figure 1.)
Figure 1. Continuous corn and harvested crop acres in the four states.
| State | Continuous corn acres (in millions) | Harvested cropland acres (in millions) | Continuous corn share of harvested cropland |
| Illinois | 3.2 | 21.6 | 15% |
| Iowa | 5.8 | 23.5 | 25% |
| Minnesota | 2.9 | 19.7 | 15% |
| Wisconsin | 3.1 | 8.8 | 36% |
| Total | 15 | 73.5 | 20% |
Source: EWG, from an analysis of USDA Cropland Data Layer and Ag Data Commons data.
There were 32 counties in the four states that each had over 100,000 acres of continuous corn, together making up 29% of all continuous corn acres in the region. Seven of those counties had over 150,000 acres each. The top three counties with the most continuous corn acres were Whiteside County, Illinois, Delaware County, Iowa and Stearns County, Minnesota.
This map shows how many acres of cropland were used to produce “continuous corn” in Illinois, Iowa, Minnesota and Wisconsin. EWG considered any field to be continuous corn if corn was grown on it for at least three consecutive years between 2016 and 2024.
Part of the scientific literature considers continuous corn to be when corn is grown in two consecutive years, so EWG took the conservative approach of using three consecutive years.
According to others’ research, across all Midwest states, around 65% of cropland is in a corn-soybean rotation, while 35% is in a two-year continuous corn system. While corn-soybean rotations, where corn is grown one year and soybeans the next, is the dominant cropping system in the Corn Belt, continuous corn is clearly still common.
There is evidence that continuous corn systems produce larger total greenhouse gas emissions, including nitrous oxide, than growing corn in rotation with other crops. Studies show that growing corn in rotation with soybeans, wheat or other crops reduces nitrous oxide emissions of the system compared to continuous corn in large part because the other crops use no or less nitrogen fertilizer. For instance, because soybeans fix nitrogen into the soil, they do not require nitrogen fertilizer, which reduces nitrous oxide emissions during the soybean stage.
Even though nitrous oxide makes up a small share of total U.S. greenhouse gas emissions, it is an important greenhouse gas. Nitrous oxide stays in the atmosphere for over 100 years and has a global warming potential 273 times more powerful than carbon dioxide.
When looking at total agricultural U.S. greenhouse gas emissions, nitrous oxide makes up the largest share at 52%. Global nitrous oxide emissions have grown by 40% between 1980 and 2020, and they are expected to increase another 30% between 2020 and 2050. (See Figure 2.) Corn production makes up over half of all nitrous oxide emissions from agriculture.
Figure 2. Average U.S. annual direct soil nitrous oxide emissions from the 1900s to 2010s
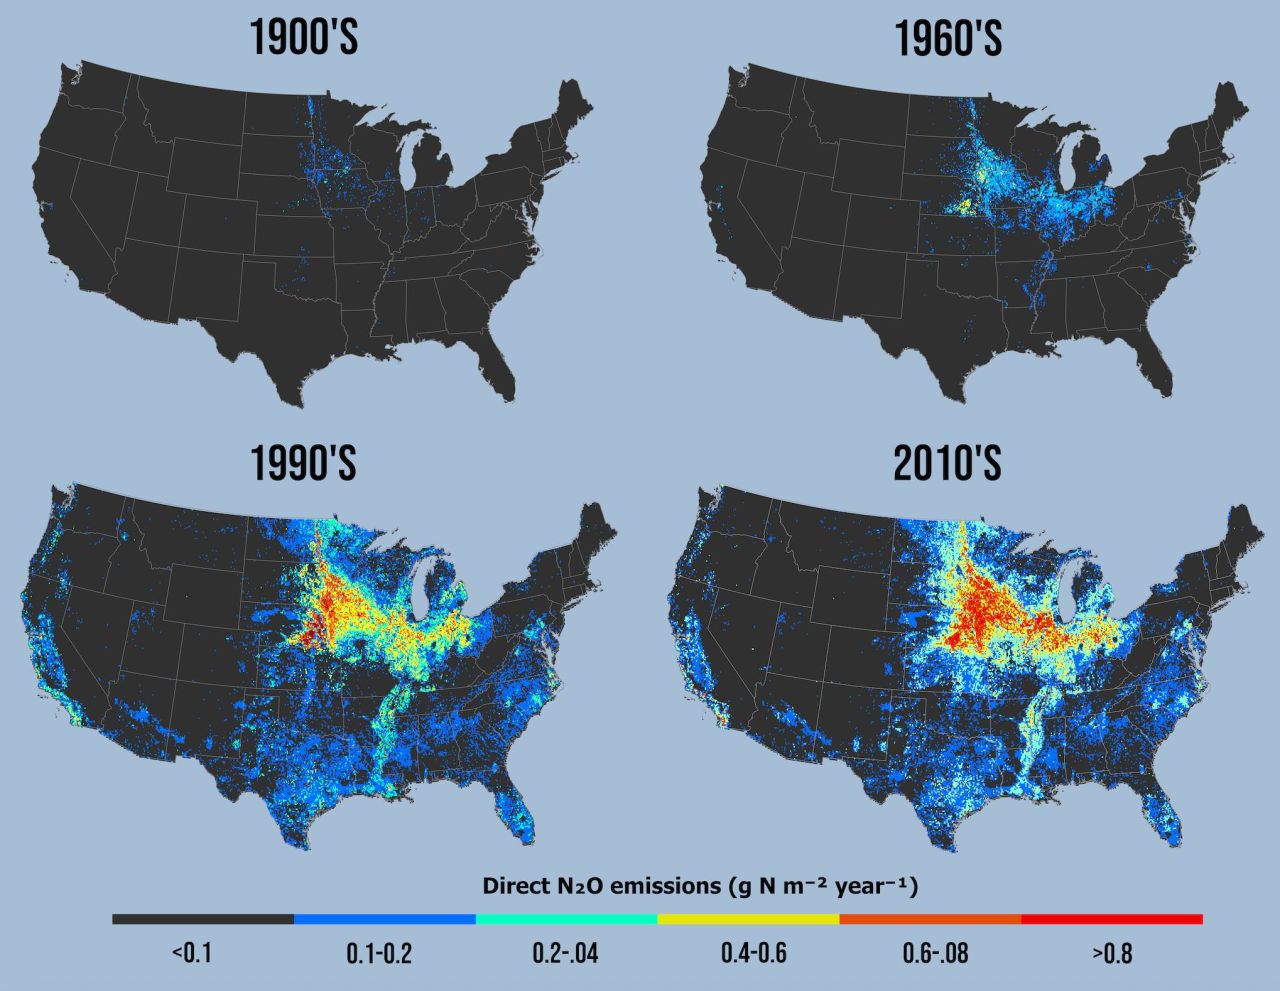
Nitrous oxide does not just contribute to climate change; it also depletes the ozone layer. And ammonia nitrous oxides can form with other compounds to create particulate matter, with exposure leading to premature deaths.
Direct nitrous oxide emissions are released from the soil through nitrification and denitrification. During nitrification, microbes turn ammonia into nitrate and release nitrous oxide during the process. In denitrification, microbes turn nitrate into nitrogen gas and release nitrous oxide.
Many different soil, management and weather characteristics determine how much nitrous oxide these processes release. The soil type and texture, amount of carbon in soil, soil pH, microbial activities and water presence are all characteristics that can affect emissions. For management practices, the amount and type of fertilizer or manure applied, tillage and irrigation practices and how much vegetation is left on soil and during which periods of the year all factor into emission amounts. Weather conditions including temperature and precipitation affect the amount of nitrous oxide that is released.
Conservation practices can reduce climate emissions
Many different conservation practices can reduce farming’s greenhouse gas emissions, including nitrous oxide. Even if it’s just on a small number of acres, it can have a big climate impact.
The amount that crop conservation practices can reduce greenhouse cases depends on farm field-level characteristics. But the USDA and Colorado State University have developed county-level estimates of such potential emissions cuts through the COMET-Planner tool.
According to the tool, there are 22 unique practices that reduce nitrous oxide emissions in Illinois, Iowa, Minnesota and Wisconsin. For the counties in those states producing continuous corn, the four practices that would generate the largest reductions in total greenhouse gas emissions are: riparian forest buffers, tree or shrub establishment, hedgerow planting and windbreak establishment, in rank order.
Adopting each of the four best practices on just 1% of continuous corn acres in the states would reduce total greenhouse gas emissions by over 3.67 million metric tons of carbon dioxide equivalent in a year. So, placing these practices on just 4% total of continuous corn acres would reduce carbon dioxide levels equivalent to getting more than 850,000 gas-powered cars off the road. (See Figure 3.)
Figure 3. Carbon dioxide car equivalent of adopting the best four conservation practices on 1% of continuous corn acres each.
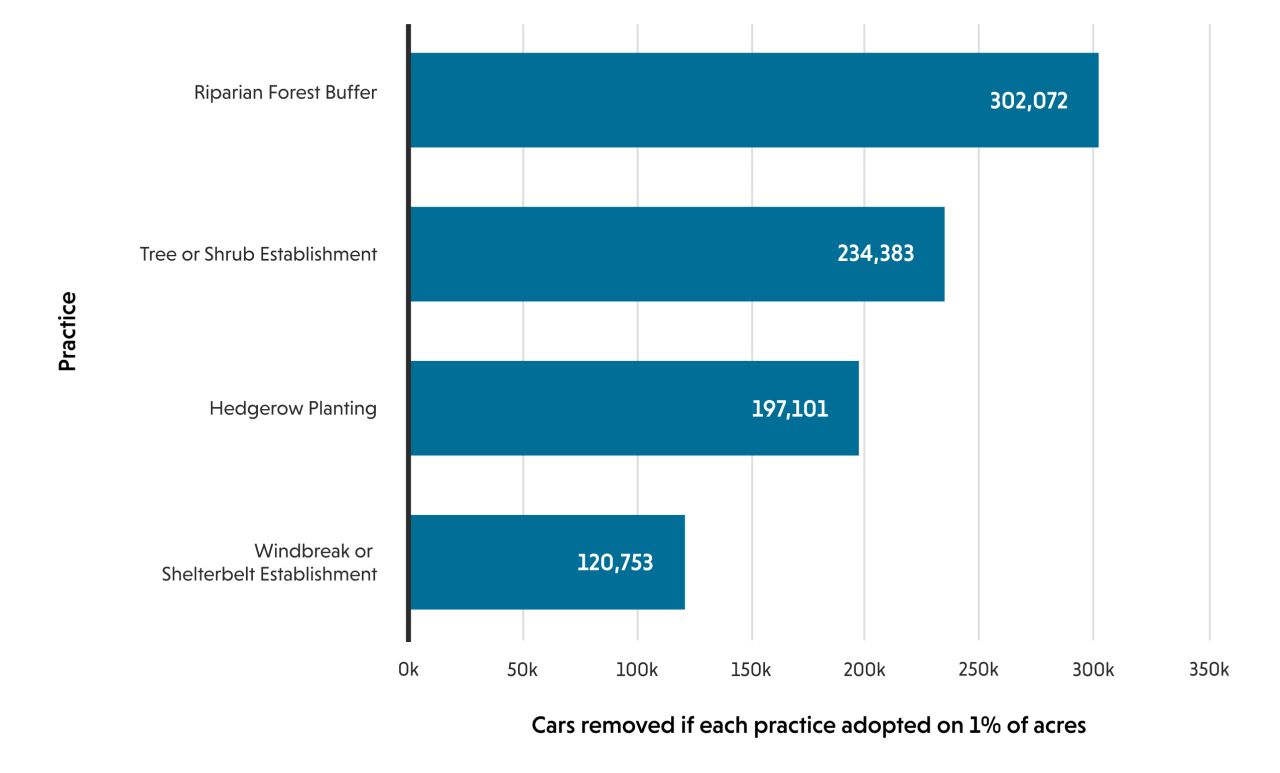
Source: EWG, from an analysis of USDA and Colorado State University COMET- Planner data
These practices, like growing small areas of trees, are the best conservation practices to reduce emissions on continuous corn acres because they take cropland out of production, sequestering carbon in soil and reducing nitrous oxide emissions. The more acres on which these practices take place, the greater the climate benefit.
But many farmers want to implement conservation practices that don’t require them to take land out of production. There are also some common practices that allow farmers to keep farming all acres while also reducing greenhouse gas emissions. Examples include implementing no-tillage, switching from commercial fertilizer to animal manure in some cases, diversifying crops so that there is a conservation crop rotation and adopting cover crops.
Many counties in the four Corn Belt states have already implemented these common working-lands practices on more than 1% of total cropland acres. Implementing each of these practices on 5% of continuous corn acres in the four states, or 20% of total acres, would reduce total emissions by almost 964,000 metric tons of carbon dioxide equivalent. That’s about the same climate benefit as removing more than 224,000 cars from the road each year. (See Figure 4.)
Figure 4. Carbon dioxide equivalent in cars removed from the road if common working-lands conservation practices were each adopted on 5% of continuous corn acres in the four states.
| Car equivalent | |
| Residue and Tillage Management - No-Till | 91,603 |
| Nutrient Management- Swine manure | 67,270 |
| Conservation Crop Rotation | 38,809 |
| Cover Crop | 26,479 |
| Total | 224,161 |
Source: EWG, from an analysis of USDA and Colorado State University COMET- Planner data, and car equivalency rate from the Environmental Protection Agency Greenhouse Gas Equivalencies Calculator
USDA and state agencies can provide more support to farmers
Conservation practices can benefit farmers, like improving soil health on their farms and saving time and money. But farmers do not have to adopt these practices alone.
The federal government provides funding through multiple farm subsidy and conservation programs. The Environmental Quality Incentives Program, or EQIP, is a federal working lands conservation program. Some states discussed in this analysis also have smaller state-based conservation programs and a few agricultural regulations.
But the USDA and Midwest state agencies can do more to encourage farmers to adopt practices that reduce climate emissions.
Funding for the most effective conservation practices should be increased across the board. While the 2022 Inflation Reduction Act increased spending from EQIP and other federal conservation programs specifically for climate-smart practices, the One Big Beautiful Bill enacted earlier this year removed this climate designation. As a result, the additional money for farmers will not specifically be paid out for practices that reduce emissions.
Practices that reduce climate emissions should be prioritized throughout federal and state conservation programs. For example, EQIP should be updated to allow states to pay 90% of the cost of EQIP practices to farmers, for practices that reduce greenhouse gas emissions.
Program reforms should also encourage long-term adoption of climate-smart practices beyond just one year, like changing EQIP to allow farmers to have three-to-five year contracts. The best practices would secure the greatest climate benefits if they stay in place for multiple years.
Changes could also be made to farm subsidy programs to encourage farmers to diversify crops and rotations. Crops that have lower climate emissions could be added to the list of crops eligible for farm subsidies, or having a crop rotation so that farmers are not just growing corn after corn could be a required condition for farmers to receive subsidies.
Fixing these and other missed opportunities with the USDA and state agencies can have a large beneficial impact on the climate and the environment.