Overview
- Nitrate pollution of drinking water is mainly caused by fertilizer and manure from agriculture.
- Even with nitrate’s known health harms, about one-fifth of the U.S. population drinks water contaminated with elevated nitrate levels.
- Climate change is making the problem worse and federal regulations aren’t doing enough to protect public health.
Roughly 18% of the U.S. population relied on drinking water from community water systems with elevated – and likely human-caused – nitrate levels between 2021 and 2023, a new EWG analysis finds.
Exposure to nitrates is linked to birth defects and cancer risks.
During the three-year period, more than 62.1 million people served by 6,114 community water systems received drinking water that tested at or above 3 milligrams per liter, or mg/L, for nitrate at least once. The analysis is based on data from EWG’s Tap Water Database, which shows the contaminants’ presence in water systems throughout the country.
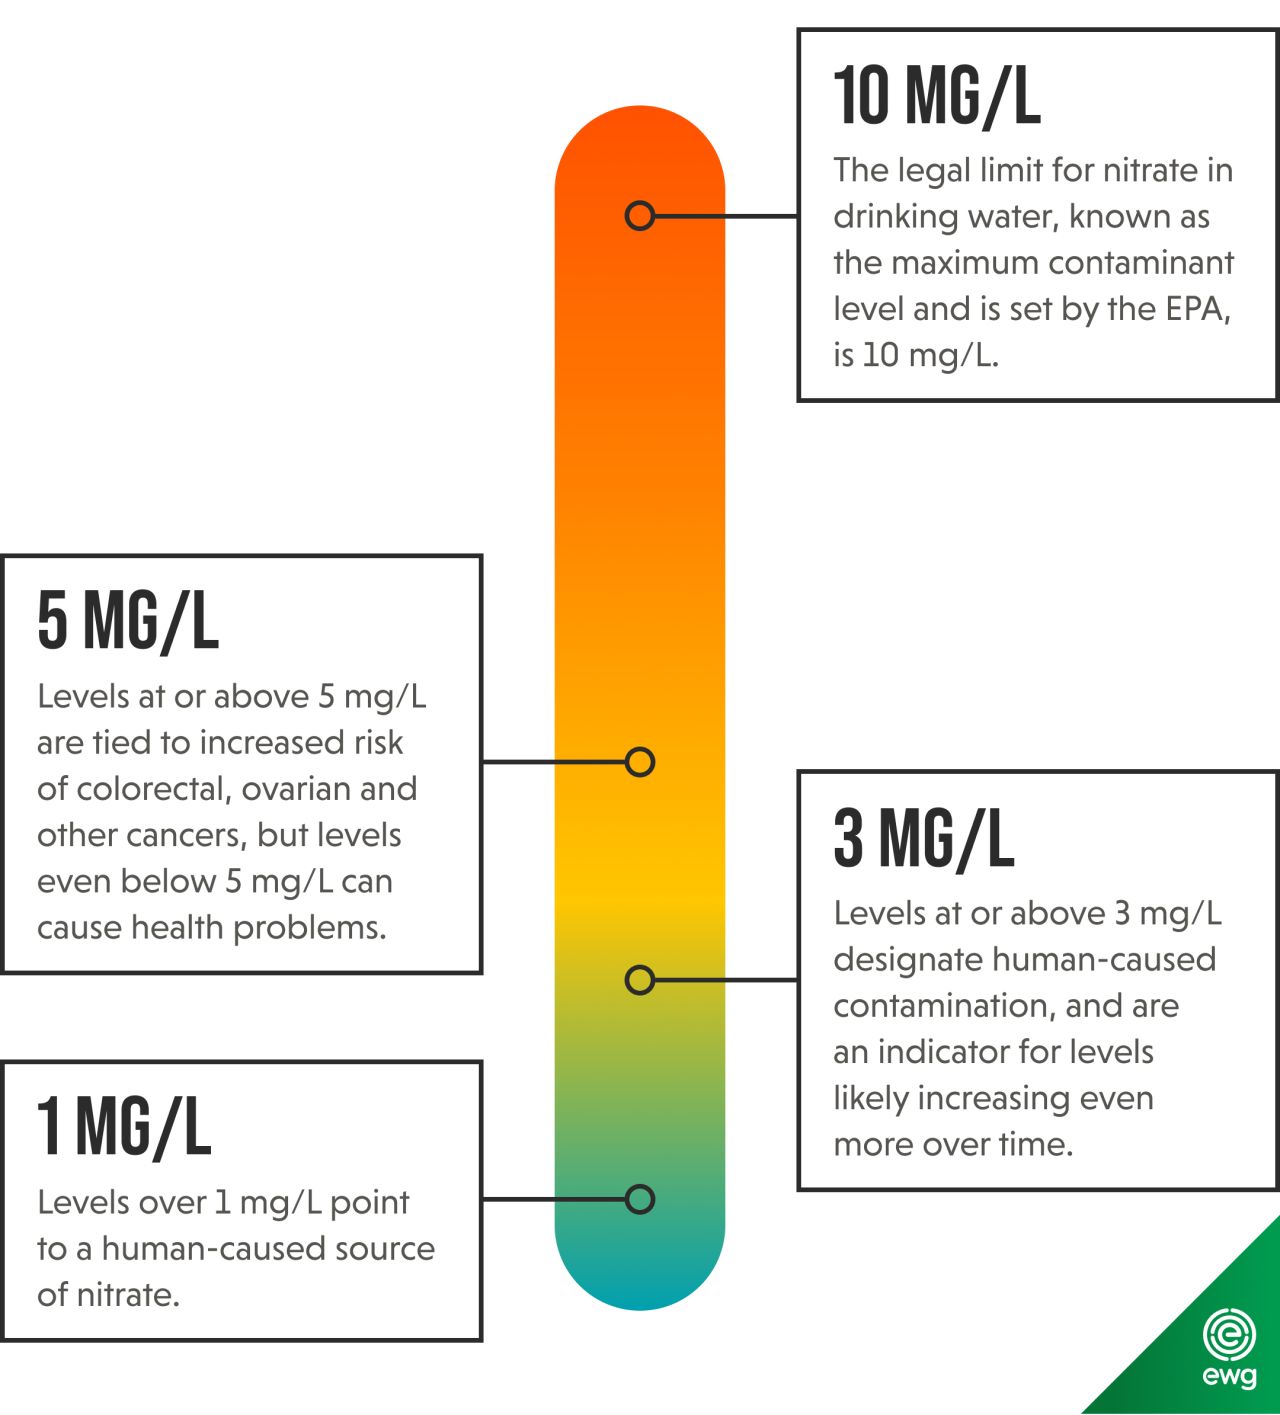
Regulators say 3 mg/L of nitrate indicates human-caused drinking-water contamination, and that nitrate contamination is likely to get worse. EWG refers to this level as “elevated nitrate.” Nitrate gets into water from fertilizer in agricultural runoff, manure from animal feeding operations and wastewater treatment plant discharge. Leaking septic tanks and urban stormwater runoff are smaller sources of nitrate pollution.
The Environmental Protection Agency’s legal limit for nitrate in drinking water, known as the maximum contaminant level, or MCL, is 10 mg/L. That standard is based on a 1962 U.S. Public Health Service recommendation designed to guard against “blue baby syndrome,” a potentially fatal condition that starves infants of oxygen if they ingest too much nitrate.
But more recent research shows strong evidence of an increased risk of colorectal and other cancers, thyroid disease and birth defects at 5 mg/L and smaller levels far below the legal limit.
In 2019, EWG scientists published a peer-reviewed meta-analysis of eight studies that evaluated the link between nitrate in drinking water and colorectal cancer. It found 0.14 mg/L as the health-based limit needed to reduce the risk of cancer, and it is used in EWG’s Tap Water Database.
The most recent update to the database, last year, found that 178 million people were served by public water systems with nitrate exceeding this health guideline.
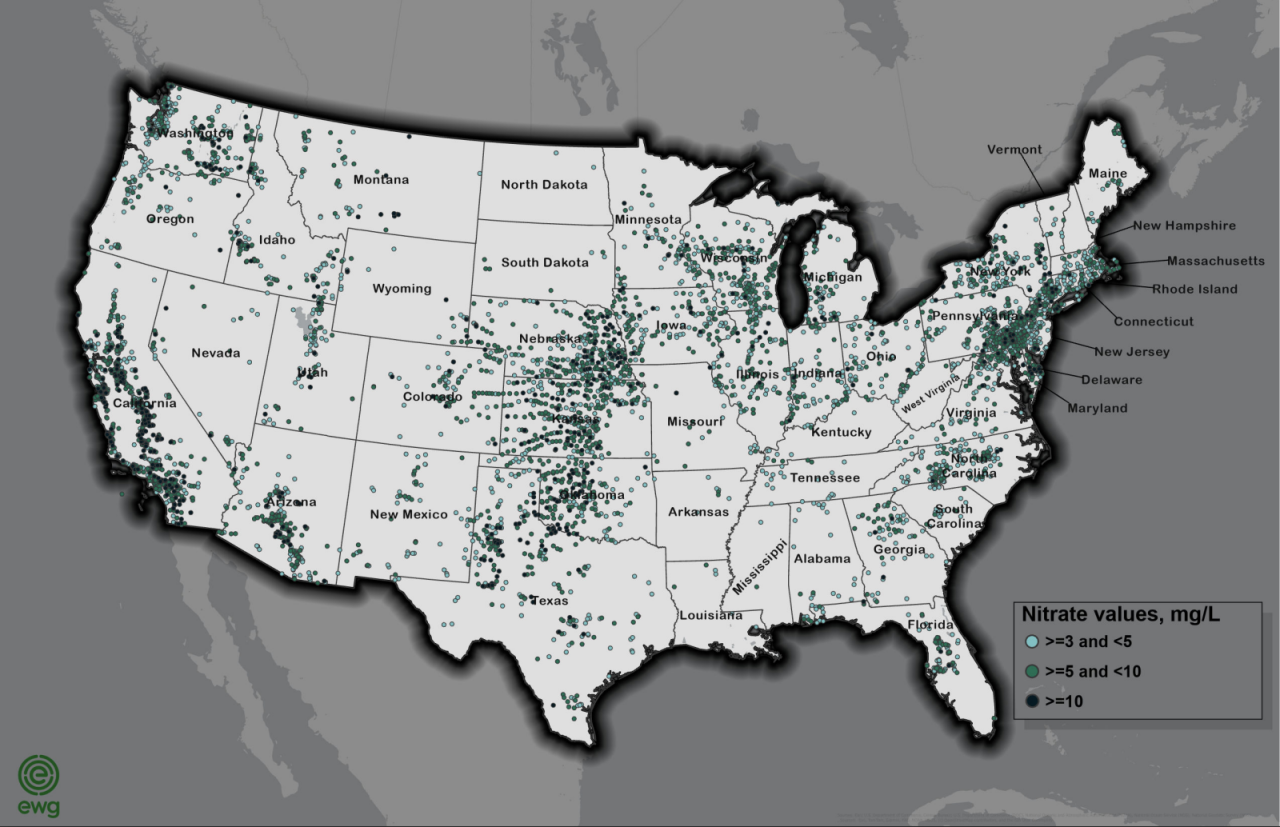
For this new analysis, EWG has created a first-of-its-kind national map of water systems with elevated nitrate between 2021 and 2023.
The map shows that agricultural states dominate the problem: California, Pennsylvania, Washington, Kansas, North Carolina, New York, Nebraska, Texas, Arizona and Wisconsin account for 60% of all water systems with elevated nitrate.
Another state grappling with nitrate contamination in drinking water is Minnesota, whose Department of Health also considers 3 mg/L to be the level that indicates human-caused sources.
To address the problem, the state has adopted a groundwater protection rule intended to curb nitrate pollution in groundwater that supplies community water systems’ drinking water. The Minnesota Department of Agriculture is reviewing whether that rule is strong enough to protect public health and drinking water supplies.
Beyond its health impacts, nitrate pollution carries significant economic costs. Removing nitrate from drinking water requires expensive treatment technologies, placing financial strain on utilities and ratepayers.
And the medical expenses associated with nitrate-related health problems add another layer of burden to families and communities.
Climate change worsens the problem
Climate change compounds nitrate pollution that’s already widespread.
Agriculture is responsible for roughly 10% of all U.S. greenhouse gases, with nitrous oxide – a potent heat-trapping gas – accounting for the largest share of those agricultural emissions. Nitrous oxide emissions are released through complex processes in farm soil after nitrogen fertilizer is applied to crops.
In turn, a warming climate intensifies weather extremes, bringing heavier rainfall, stronger storms and prolonged droughts, often in the same places but at different times. These shifting conditions increase runoff and soil erosion, which wash nitrate into lakes, rivers, streams and groundwater. In this way, fertilizer use not only drives climate change but also amplifies the pollution of drinking water supplies.
Federal agricultural policies add to the nitrate problem.
Farm subsidies and the federal Crop Insurance Program strongly promote production of corn, the most fertilizer-intensive crop grown in the U.S. But preventing nitrate from getting into drinking water in the first place can be cheaper than removing it through water treatment.
Policy reform can help. Federal conservation programs and state policies could be structured to encourage or require farmers to adopt more conservation practices like cover crops and diversified crop rotations. Changes like these could reduce the amount of nitrate that ends up in drinking water, lowering treatment costs and improving public health.
Elevated levels of nitrate across the U.S.
Nitrate in drinking water is a nationwide problem that does not just affect people in rural areas.
Of the 62.1 million people served by community water systems that tested at or above 3 mg/L between 2021 and 2023, 3,201 systems, serving 38 million people, tested at or above 5 mg/L at least once. 606 systems, serving more than 3 million people, tested at or above the legal limit of 10 mg/L.
During those three years, 39,592 community water systems tested their drinking water for nitrate. (See Table 1.)
Table 1. Water systems and the populations they serve that are tested for nitrate contamination.
Count of community water systems | Percent of all systems that tested for nitrate | Population served by systems (in millions) | Percent of population served by all systems that tested for nitrate | |
All systems with at least 1 nitrate test | 39,592 |
| 302 |
|
At least 1 test>=3 mg/L | 6,114 | 15 | 62 | 21 |
At least 1 test>=5 mg/L | 3,201 | 8 | 38 | 13 |
At least 1 test>=10 mg/L | 606 | 2 | 3 | 1 |
Source: EWG, from data in EWG’s Tap Water Database
Some water systems had hundreds of tests with elevated nitrate over the years.
For example, in California, Fresno had 2,685 tests at or above 3 mg/L, while San Bernardino had just under 2,000 tests at or above 3 mg/L during the three years. Not all water systems conduct the same number of tests each year.
Larger systems, such as those in the two California cities, test more often than small systems.
There were also many systems with nitrate levels in their drinking water far above the legal limit of 10 mg/L. A total of 70 systems tested at or above two times the MCL, 20 mg/L of nitrate, and 21 systems tested at or above three times the MCL, 30 mg/L.
Most of the systems with the highest nitrate tests were small, but some served thousands of people, such as Garden City, Kan., which served over 35,000 people and had a maximum nitrate test of 37 mg/L.
Agriculture is big business in all the 10 states with the most systems with elevated nitrate. In order of the states with the most systems, they are California, Pennsylvania, Washington, Kansas, North Carolina, New York, Nebraska, Texas, Arizona and Wisconsin.
And just five agricultural states contained 64% of all water systems at or above the legal limit. In the order of states with the most systems, they are California, Texas, Kansas, Nebraska and Oklahoma.
EWG has created the first-of-its-kind map to track all community water systems with elevated nitrate.
Map of the 6,114 community water systems with elevated nitrate between 2021 and 2023
Nitrate contaminates both groundwater and surface water. Many of the larger systems use surface water, like lakes and rivers, and most of the smaller systems use groundwater.
And four in five systems with elevated nitrate were very small, defined as serving 500 people or fewer. Or they were small systems, defined as serving between 501 and 3,300 people. It can be extremely costly for very small or small systems to remove nitrate from drinking water, since they have fewer customers to charge in order to help spread the cost.
Since nitrate mostly comes from agriculture, many people mistakenly believe it is a problem only near fields in small rural towns near fields. But nitrate pollutes drinking water in large cities too, and all sizes of communities in between.
Even though very small and small systems make up most of the systems with elevated nitrate, large and very large systems serve most of the exposed population.
Just 741 large systems, serving 10,001 to 100,000 people each, and very large systems, with more than 100,000 people each, served 91% of the population with elevated nitrate.
These large and very large systems made up just 12% of all systems with elevated nitrate but served 56.5 million people. Some of the largest cities with elevated nitrate include Los Angeles and Phoenix. (See Table 2.)
Table 2. Six community water systems each served over 1 million people and had elevated nitrate.
System name | State | People served by water system (in millions) | Number of tests at or above 3 mg/L |
Los Angeles Department of Water and Power | California | 3.9 | 255 |
Phoenix | Arizona | 1.7 | 19 |
Philadelphia Water Department | Pennsylvania | 1.6 | 27 |
Las Vegas Valley Water District | Nevada | 1.5 | 18 |
Columbus Public Water System | Ohio | 1.3 | 15 |
San Jose Water Company | California | 1.0 | 177 |
Source: EWG, from data in EWG’s Tap Water Database
Pollution from agriculture can contaminate the aquifer a city uses, even if the farms are many miles away from the city. Surface water systems draw on water from lakes, reservoirs and rivers. Agricultural contaminants can run off fields upstream and end up in surface water sources downstream, away from the initial sources of farm contamination.
An expensive problem
The health impacts linked to nitrate contamination carry substantial medical costs.
Previous research by EWG scientists estimates that treating cancers attributable to nitrate exposure costs the U.S. between $250 million and $1.5 billion annually, with Wisconsin alone facing $23 million to $80 million each year.
Indirect costs, such as lost productivity for those living with cancer, are even higher.
Looking at just one state that has a significant nitrate problem, researchers in Minnesota recently estimated that the direct medical costs and the costs for quality of life adjustments for health conditions that are tied to nitrate amount to $745 million per year.
This figure underestimates the true costs, since it includes only populations that drink water from a community water system, and not the over 1.15 million Minnesotans who get their water from private wells.
Officials in Denmark are considering lowering the nitrate limit in drinking water, based on the health outcomes and high medical costs to treat them. Studies in Denmark have shown that the medical costs saved by lowering the nitrate standard would be much greater than the added costs of water systems having to reduce nitrate levels to a lower limit through water treatment.
Experts have suggested the country adopt a nitrate drinking water standard around 1.3 mg/L, much lower than the U.S. and European Union standards.
The treatment costs for water systems to remove nitrate from drinking water are also expensive but worth the money to reduce the health impacts of nitrate consumption and the associated medical costs. Treatment costs depend on the size of the system, the concentration of nitrate in the water and the concentration goal for the treatment. While a big city can spread the cost of treatment over a larger customer base, small communities have fewer people to spread costs across, which leads to a larger financial burden per household.
For example, Chippewa Falls, Wis., installed a new nitrate treatment plant, in 1998, at the cost of $2.5 million. For a water system that serves just over 13,000 people, this would have been a high cost per person if the costs had been fully passed on to water customers.
Des Moines, Iowa, is also a good example of how expensive it can be to remove nitrate from drinking water.
In 1992, Des Moines Water Works finished building a nitrate removal facility, at the cost of $4.1 million. The treatment system now costs around $10,000 a day to operate in the summer season, when nitrate levels in the source water are high. In 2025, Des Moines Water Works ran its nitrate removal system for 112 days to get nitrate levels below the MCL.
The costs of advanced water treatment have benefits beyond just removing nitrate, as highlighted in a recent paper from EWG scientists that looked at the co-removal benefits of water filtration that could also reduce the levels of arsenic and chromium-6.
The health benefits of contaminant co-removal are not typically considered in the current regulatory framework, which looks at the costs and benefits of removing or reducing levels of one contaminant at a time.
Agriculture reinforces climate change, and climate change worsens nitrate pollution
Agriculture produces greenhouse gases, which contribute to climate change, and climate change causes more extreme weather, which worsens the problem of nitrate contamination of drinking water.
Farming accounts for roughly 10% of total U.S. greenhouse gas emissions, and nitrous oxide is the largest greenhouse gas produced by agriculture. As climate change accelerates, farmers face growing pressure to cut emissions and prevent agriculture from becoming the nation’s leading source of climate pollution.
Agriculture’s emissions are still going up while emissions in other sectors, such as transportation and electric power, are already decreasing. Agriculture’s emissions are expected to increase a quarter of a percent every year through 2050, going up more than 5% total.
Forecasts show that climate change is leading to more rain or drought or both, depending on the region. Both excessive rain and increased drought can lead to more nitrate pollution of water from farms.
In the major agricultural region of the Midwest, there has already been increased precipitation in the 1992-2021 period, compared to 1901-1960. And precipitation amounts are expected to increase across the Midwest by 2050, along with an expansion in the number of extreme precipitation events each year.
But periods of drought are also expected across the region, even though the overall trend is for growing amounts of precipitation.
More precipitation in general, as well as more intense extreme precipitation events, leads to more nitrate getting into both groundwater and surface water. Even small precipitation increases can cause sharp growths in the amount of nitrogen that gets into water from farms.
Droughts can also lead to more nitrate pollution of water. Drought concentrates nitrogen in soil, so large amounts of nitrate get into water when it rains after drought periods. That’s true of normal precipitation amounts but also extreme storms. According to the U.S. Geological Survey, some of the highest nitrogen levels ever recorded in Midwest streams were found in 2013, when spring rains came following a period of drought in 2012.
Climate change also likely increases nitrous oxide emissions from farming. Up to a certain point, higher levels of soil moisture contribute to greater emissions of nitrous oxide. Because of this, cropland acres in flood plains are likely to be nitrous-oxide-producing hot spots, since they are more likely to have higher levels of soil moisture than cropland located outside a flood plain.
More frequent precipitation or extreme rain events can make farms wetter, and water-logged fields can be hot spots of nitrous oxide emissions.
Federal and state solutions
Consumers
Consumers can search their postal code in EWG’s Tap Water Database to see whether nitrate is in their water. The database reports contaminants in public drinking water, which is regulated by the EPA. Public water systems are required to keep nitrate levels in drinking water below 10 mg/L. EWG’s health-based limit for nitrate in drinking water is 0.14 mg/L.
The Tap Water Database also provides general water filter recommendations for nitrate and other contaminants that may be detected in your public water supply.
Private well water is not regulated by the EPA, or any other federal agency, and most states do not require private wells to be tested for nitrate or other contaminants. Consumers on private wells should get their wells tested for a suite of contaminants including nitrate each year, especially if the private well is in an agricultural area.
If a private well owner finds nitrate in their water after it is tested, there are many different options available to treat the contamination, such as reverse osmosis and ion exchange.
Federal policies
Farm policies contribute to nitrate pollution of drinking water. Changes should be made to farm subsidy programs to encourage farmers to diversify crops and rotations.
Crops with lower climate emissions and water quality impacts could be added to the list of crops eligible for farm subsidies, or diversified crop rotations could be a required condition for farmers to receive subsidies.
Farmers adopting conservation practices on their farms also help reduce levels of nitrate in drinking water. But too much money from federal conservation programs goes to practices that do not reduce nitrate pollution, especially structural practices like irrigation pipelines and animal waste pits.
Federal conservation programs, such as the Environmental Quality Incentives Program and Conservation Stewardship Program, should be reformed to prioritize better practices that reduce nitrate pollution. One example of that is EWG’s list of regenerative practices that have significant water quality benefits, in addition to lowering climate emissions.
The EPA should prioritize an updated assessment of the health impacts of nitrate in drinking water, paving the way for a potential lowering of the MCL. In 2017, the agency initiated the process of re-evaluating the nitrate MCL. The first step of that process is for the EPA to conduct a new nitrate health assessment, since the last health assessment was completed many decades ago.
Recent scientific evidence provides compelling documentation of the health risks associated with nitrate exposure, underscoring the urgent need to reconsider and potentially reduce the current MCL to better protect public health.
According to the EPA, the health assessment process began in 2017 before being paused by the first Trump administration, in 2019. It was then picked back up by the Biden administration, in 2023. The second Trump administration has not paused the health assessment yet, but an EPA spokesperson has said the agency has not set a date for a release of the draft assessment. And the assessment is conducted by the EPA’s Office of Research and Development, which started to be dissolved and experienced severe layoffs in 2025 in President Donald Trump’s second term.
State policies
States facing widespread nitrate contamination in drinking water supplies should adopt policies that actively limit nitrate pollution.
Minnesota provides a strong model for effective regulation. In 2017, the state began requiring up to 50 feet of vegetative buffers between farm fields and lakes, rivers and streams. Minnesota also has a Groundwater Protection Rule that prohibits farmers from applying fertilizer to land in the fall and on frozen fields in areas where the groundwater is vulnerable to nitrate contamination.
Together, these measures have begun to lower nitrate pollution, and other states could implement similar strategies to safeguard public drinking water.