Overview
- California’s total number of hot days ranging from “moderate” to “extreme” heat has risen 12.9% over the past 20 years
- Depending on the region, the state now experiences 2 to 42 days a year of dangerous “major” or “extreme” heat — a 55% average increase over the last two decades
- To cope with California’s heat, consumers spend $4 billion per year on air conditioning, ranging from $95 to $800 annually per family
- Electricity from customer-sited rooftop and balcony solar can fully offset these costs, addressing affordability and reducing strain on the electric grid on hot, summer days
California has always been warm but climate change is driving up “major” and “extreme” heat advisories between 30% and 145% in parts of the state, new EWG research finds. Yet soaring electricity costs make home cooling unaffordable for millions, threatening public health.
This dynamic creates an impossible choice for many Californians struggling with affordability: suffer during hazardous heat or default on electricity bills.
The National Weather Service defines what qualifies as a certain heat day, and EWG’s report relies on those definitions. Even “minor” heat days can threaten the safety of heat-sensitive people. “Major” and “extreme” heat days threaten everyone’s health if people can’t get hydration and/or cooling. These latter two types of days put everyone at risk of heat stroke, severe dehydration, mental health challenges and other forms of heat injury.
On average, California saw a 55% increase in the number of heat advisory days classified as major or extreme over the last 20 years, EWG found. Certain counties saw higher numbers of days classified as major or extreme heat than others.
| County | Percentage increase (2006-2015 vs. 2016-2025) | Average major and extreme heat risk days (2015-2024) |
|---|---|---|
| San Bernardino | 61.2% | 42 |
| Riverside | 58.1% | 34 |
| Los Angeles | 30.8% | 33 |
| San Diego | 40.2% | 21 |
| Fresno | 54.6% | 13 |
| San Francisco | 145% | 2 |
And it’s not just major and extreme heat days on the uptick. The total number of days deemed anywhere from “moderate” to “extreme” rose by 12.9% over the last two decades.
Air conditioning can bring much-needed relief, but EWG’s research found that home access to cooling in the state varies widely between traditionally hotter climates versus cooler climates, as well as by housing type.
According to U.S. Census data, 92% of Californians living in inland counties, for example, have access to an air conditioner inside the home, compared to just 70% in coastal areas. And all along the Central and Northern coast, including San Francisco, community-wide rates are as low as 35%. Furthermore, just 64% of two- to four-bedroom unit apartments statewide have access to air conditioning, EWG found.
This means the jump in major and extreme events in these areas creates a unique public health threat that many families lack the equipment to manage.
But access to an air conditioner is only half the equation – being able to afford to run it is the other half. California consumers spend $4 billion per year on residential air conditioning. These costs amount to $95 to $800 in extra utility bill costs annually per family.
Almost 7 million California households are behind in their utility bill payments. Many of these families may be forced to choose to go without air conditioning rather than risk adding to their already sky-high charges. This can create public health risks for these families. People shouldn’t have to choose between affordability and their health.
Policymakers need to look for solutions that tackle both the heat and utility bills. One step is doing more to expand consumer access to distributed generation devices, such as rooftop solar or balcony solar, that can help power electricity-hungry air conditioners more cost effectively and without contributing to climate change or adding strain to the electric grid.
A hot state gets hotter
EWG used NWS data to calculate heat risk across the state, using the NWS definitions for types of heat (see Table 1):
Table 1. NWS heat risk definitions
| Heat classification | Description |
|---|---|
| Minor | Primarily affects those who are extremely sensitive to heat and without cooling/hydration |
| Moderate | Affects those who are sensitive to heat, especially those without cooling/hydration, and some health systems and industries |
| Major | Affects anyone without cooling/hydration as well as health systems and industries |
| Extreme | Rare and/or long-duration extreme heat with no overnight relief affecting anyone without cooling/hydration as well as health systems, industries, and infrastructure |
California is a hot state. Over the last decade, California counties averaged at least 191 days per year, or 52.3% of the days, experiencing some level of heat risk.
On these days, air conditioning is desirable for people’s comfort and productivity. Indoor cooling can also be a public health necessity on even moderate heat days for sensitive populations, such as infants, young children, seniors, pregnant women and those with medical conditions.
Major and extreme heat risk is also on the rise in California, with the state seeing a greater increase in the proportion of days that fall into these two categories over the last two decades. On these days, anyone without cooling or hydration is at risk of injury from the heat.
From 2006 to 2015, the state averaged 3.12% of days defined as major or extreme heat risk. This ticked up to an average of 4.81% of days from 2016 to 2025. While this is just a 1.69 percentage point increase, it represents a startling 54.2% spike in the proportion of major or extreme heat risk days in California (see Figures 1 and 2). This amounts to a growth from 11 days per year to 17.5 days per year labeled as major or extreme.
Figure 1. Proportion of heat risk days reaching “major” or “extreme” levels
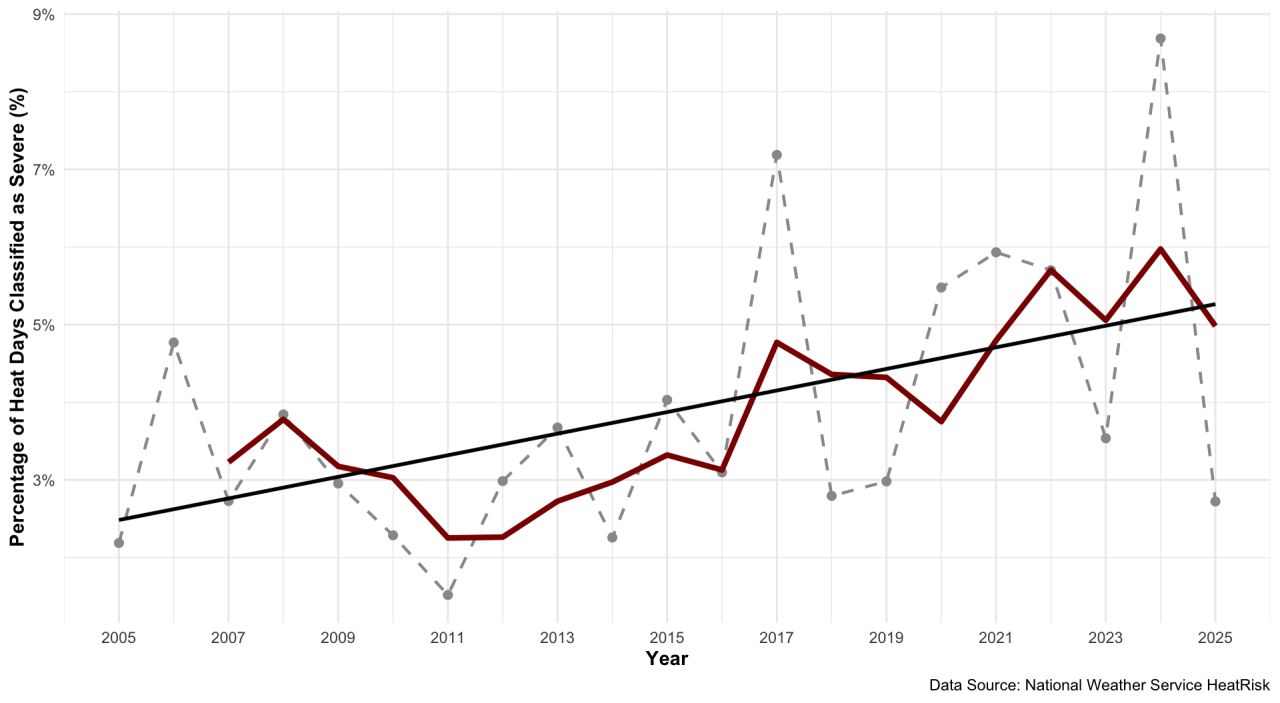
Dark red represents three-year moving average, solid black represents the overall trend and gray represents the annual data
Figure 2. Proportion of heat risk days reaching “moderate” levels
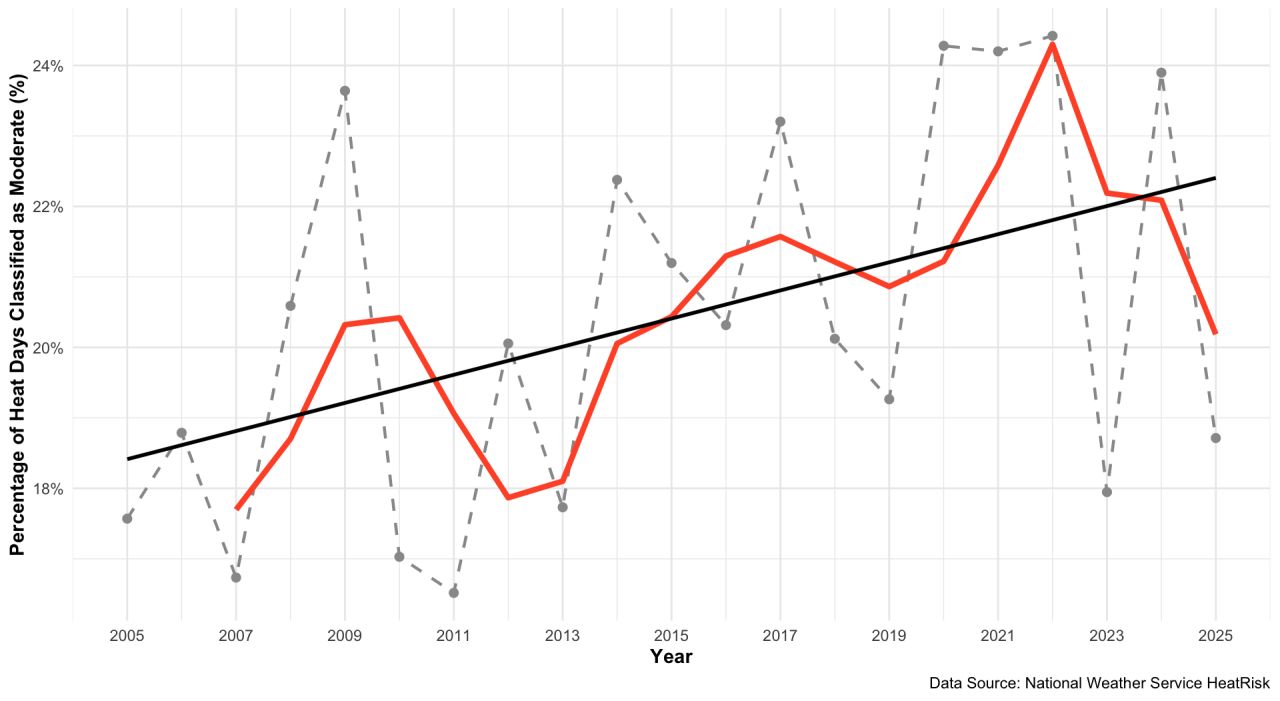
Orange line represents three-year moving average of moderate days, solid represents the overall trend and gray represents the annual data
Different regions are seeing a greater rise in major and extreme heat than others although nearly every region in the state is seeing some level of uptick of extreme heat.
| County | Percentage increase (2005-2014 vs. 2015-2024) | Average major and extreme heat risk days (2015-2024) |
|---|---|---|
| San Bernardino | 61.2% | 42 |
| Riverside | 58.1% | 34 |
| Los Angeles | 30.8% | 33 |
| San Diego | 40.2% | 21 |
| Fresno | 54.6% | 13 |
| Sacramento | 111.4% | 10 |
| Santa Clara | 100% | 5 |
| Santa Barbara | 36.8% | 4 |
| Sonoma | 36.7% | 4 |
| San Francisco | 145% | 2 |
Importance of air conditioning
As more Californians face increased extreme heat, access to air conditioning becomes more important.
According to U.S. Census data, 78.61% of California households statewide have access to air conditioning devices at home, but that prevalence varies widely by dwelling type and region.
Statewide, 80% of single-family homes have air conditioning, whereas only 64% of two- to four-bedroom apartments have air conditioning.
EWG’s research also found that while 92% of all households in inland counties have air conditioning, that number drops to 70% in coastal counties. Many coastal counties, like San Francisco, see air conditioning rates less than half those of their inland neighbors (see Figure 3).
Figure 3. Air conditioning prevalence across California counties
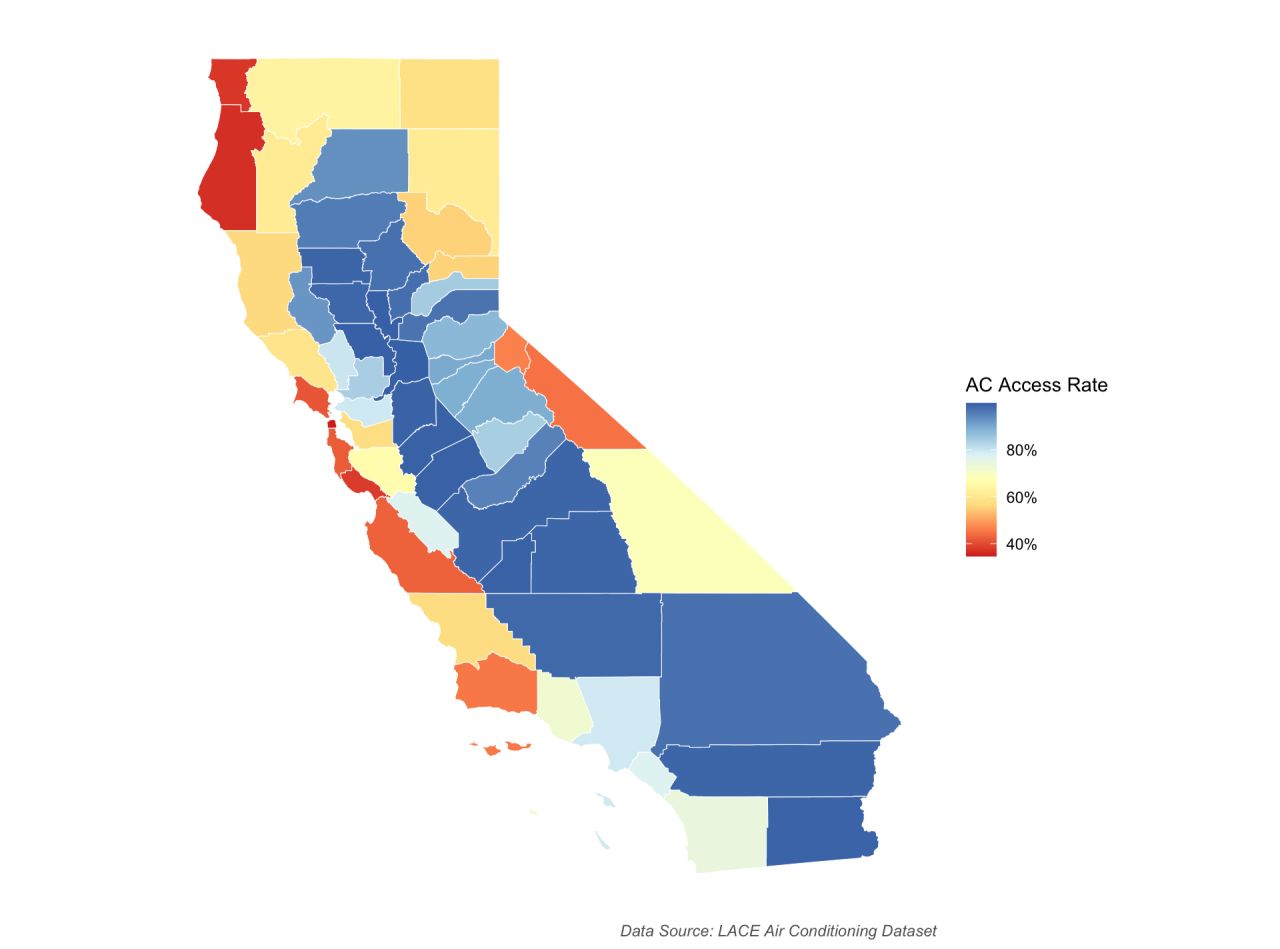
AC access rate represents the percent of occupied households with functional ai conditioning access
Further elevating the challenges with rising heat is the fact that more of the state’s population is staying home than ever before. Today, 13% of Californians work from home. Many Californians are also primarily at home during the hot summer months due to many reasons ranging from seasonal work schedules, school breaks, and being permanently at home due to health issues.
Affordability and sky-high utility bills
With major and extreme heat on the rise combined with the fact that California has the second highest average electricity rates in the nation, California faces the dual problem of public health threats from heat and energy affordability.
This general upward trend in heat adds to California’s cost of living challenges. Consumers in the state collectively spend $4 billion per year on residential air conditioning, which can only be expected to go up as the state continues to get hotter and air conditioning becomes a greater necessity for more Californians.
For individual households, based on peak summer rates for the least and most expensive utility service territories, the cost of running home air conditioners in California breaks down to:
$95 to $529 per year for an average 1-bedroom apartment, depending on the utility service territory.
$450 to $800 per year for an average sized single-family home, depending on the utility service territory.
Not everyone can afford to pay their utility bill even if they have access to an air conditioning device inside their home. Almost 7 million California ratepayers are in some form of utility debt (see Figure 4).
The investor-owned utility service territories with the highest arrears are mostly in the Central Valley, which also has the highest rates of air conditioning prevalence and high heat.
Figure 4. Q3 2024 utilities arrears in California by ZIP code
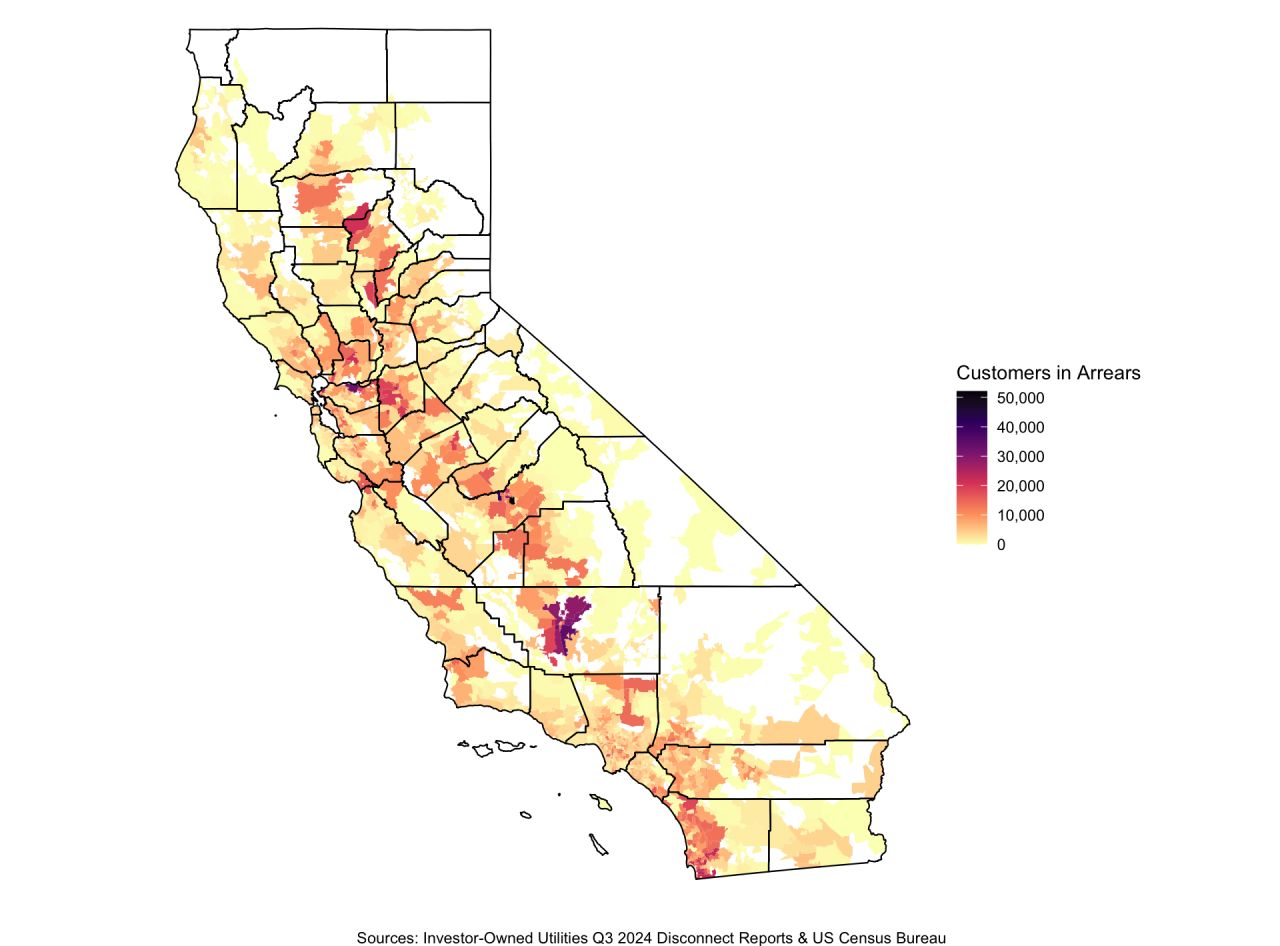
Map represents total count of customers more than 30 days in arrears. Note: This map does not include customers in publicly owned utility territories.
Solar solutions can provide relief
With temperatures continuing to rise, California policymakers should do more to increase access to customer-sited solar energy solutions that can help make cooling more affordable, along with other solutions like energy efficiency.
Self-generation of electricity, either from a rooftop solar system or from a smaller balcony solar system, are two proven methods for reducing home energy bills while powering necessary air conditioning, reducing strain on the electric grid and helping fight climate change.
There are different ways for consumers to get access to cost-saving solar energy technologies.
The most common are professionally-installed solar photovoltaic systems. Over two million systems are located on residential properties throughout California, including hundreds of multi-family apartment buildings. These systems are hard-wired into the building and typically located on roofs but can also be built on elevated canopies over parking lots.
These rooftop solar systems can fully cover air conditioning costs and power needs. A central air conditioning system in an average sized single-family home requires 1,372 kilowatt-hours per year according to the California Energy Commission. This is an average number. Single-family homes located in hotter regions will likely use much more electricity for cooling.
The average residential rooftop solar system has a capacity of 6,000 watts. In California, a 6,000-watt system can be expected to generate 9,000 kilowatt hours of electricity saving families an average of $3,120 per year. Full details of EWG’s justification for the estimated costs, savings and power generation of solar systems are in the report's methodology.
When combined with home energy efficiency upgrades, these systems dramatically reduce home energy costs and allow residents to cool their homes without worrying about going into debt with their electricity bills just to stay safe during major or extreme heat events.
Benefits of balcony solar
Balcony solar, also known as plug-in solar, is another emerging form of customer-sited solar energy. It uses the same technology found on roofs but these systems are smaller, portable and easy to install by residents.
Over the course of a year, even the smallest balcony solar system will offset the electrical costs of running a window air conditioning unit during the hot summer months.
For example, a small 180-watt balcony solar system could generate 284 kilowatt hours in a year. A small window air conditioner unit requires 289 kilowatt hours in a year, so a balcony solar system could offset that unit’s electricity needs throughout the year. This would help keep people cool in the summer without adding to their annual budget.
A larger plug in solar system that is 1,200 watts in size could generate 1,892 kilowatt-hours in a year, enough to offset a large central air conditioning system which consumes 1,372 kilowatt-hours on average. These balcony solar systems could save consumers anywhere from $95 to $800 per year on utility bill savings depending on size and location.
SB 868, a bill introduced in the California Senate by state Sen. Scott Wiener (D-San Francisco), would open up opportunities for California consumers to access balcony or plug-in solar systems. EWG is sponsoring the legislation because it offers an environmentally-friendly financial lifeline at a time of high utility bills.
For those who live or work from home, access to solar-powered air conditioning is obvious. For those who work outside the home, pre-cooling the home or apartment during the day can also help lower electric bill costs.
Additionally, adding a battery to either a rooftop or balcony system can enhance savings and give consumers greater flexibility in deciding when to run air conditioners.
Need for quick action
California has always been one of the hottest states in the country. Due to climate change, the heat facing the state is getting more severe. This increased heat means increased need to run air conditioners which, given rising electricity prices, creates a dual problem for consumers.
The state must take the lead on implementing helpful policy solutions that make it easier for Californians to access money-saving balcony and rooftop solar systems. With no foreseeable end to the rising temperatures or utility rates, this leadership is vital for both energy affordability and for public safety.